Exposure-response functions relating intensity and duration of ambient traffic-related air pollution to systolic blood pressure
Exposure to traffic-related air pollution (TRAP) is associated with adverse health outcomes, including elevated blood pressure and hypertension. However, the nature of the exposure-response functions for these associations is not well established. We recently published a three-exposure, three-period crossover trial where we showed that using portable high-efficiency particulate air (HEPA) filters to reduce indoor infiltration of TRAP was effective at preventing short-term increases in systolic blood pressure (SBP). We measured particle number concentrations (PNC) and black carbon (BC) concentrations continuously during the trial, and we measured participant blood pressures every 10 minutes. In the present study, we derive exposure-response functions that incorporate both intensity and duration of PNC and BC.
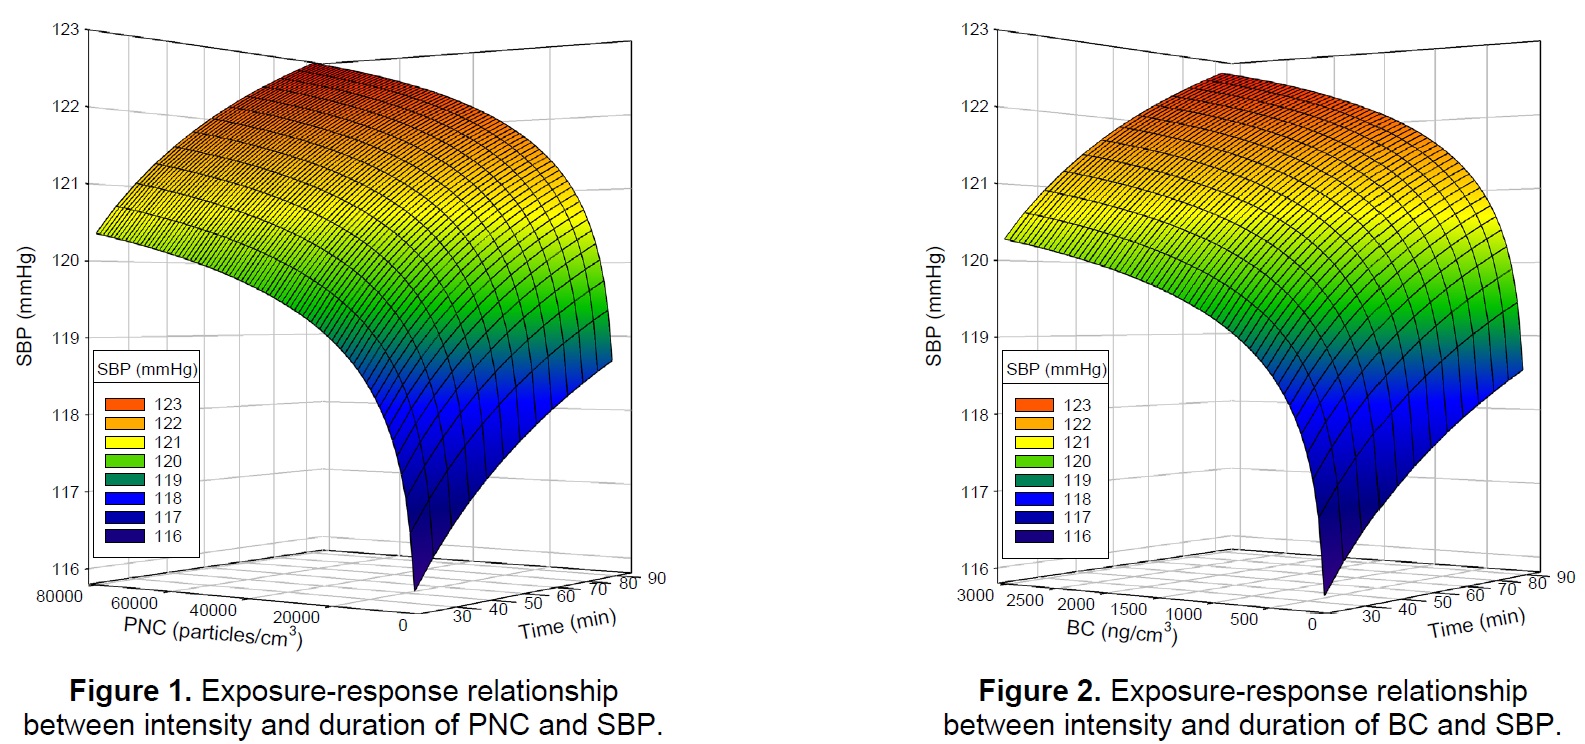
A total of 1514 SBP measures arising from 77 participants were analyzed. The average age of the participants was 60 years, 79% were female, 77% were Asian, and 17% were White. None had serious health conditions. The average SBP was 120 mmHg, the average PNC was 13,000 particles/cm3 (range 860 to 99,000 particles/cm3), and the average BC concentration was 450 ng/m3 (range 16 to 2700 ng/m3). Linear mixed models were used to fit logarithmic relationships between PNC and SBP and between BC and SBP. The models included the variable ‘time from study entry’ as a measure of exposure duration and a random intercept to account for the interdependence of multiple SBPs recorded from each participant. The resulting models, yielding statistically significant regression coefficients (p < 0.001), can be written (and displayed in Figures 1 and 2) as: SBP = 101.22 + 0.98 logePNC + 2.38 logeTIME and SBP = 104.97 + 0.93 logeBC + 2.32 logeTIME. The similarity in coefficients between the PNC and BC models can be explained by the relatively high correlation between these two measures of exposure (Pearson correlation = 0.80). Although both models describe a progressive dampening of the increase in SBP for increasing intensities and durations of exposure, duration of exposure has a greater effect on SBP than does intensity; a 1 mmHg increase in SBP is related to an approximate 53% increase in duration but a 185% increase in intensity.
In summary, the results of the present study suggest exposure-response functions for PNC and SBP, and for BC and SBP, that are logarithmically dependent on two dimensions of exposure, intensity and duration.